Transmissions from a new project on the data frontier:
2013-04-29 23:11Z:
Three days wandering landscape of one-billion-plus geolocated Tweets. Overstimulated. Devising computer-aided system to generate density fields. Will calm noise, help to answer important questions:
How does global conversation vary over time and space?
Windiest place – spot with most characters per Tweet – in world?
“Hella” tweeted more from downtown San Francisco or Telegraph Avenue in Berkeley?
2013-05-04 03:27Z:
Density estimation apparatus under development.
Inverse-squared approach consumes all available resources. Still running.
Kernel density looks blobby, oversmeared, gappy. Feels arbitrary, artificial.
Binning replaces fine data detail with cell structure. Like feeding Tweets through woodchipper, slopping pulp into buckets.
Frustrated. Radioed home base. Response drowned out by Retweet static. Will rest here.
2013-05-06 12:08Z:
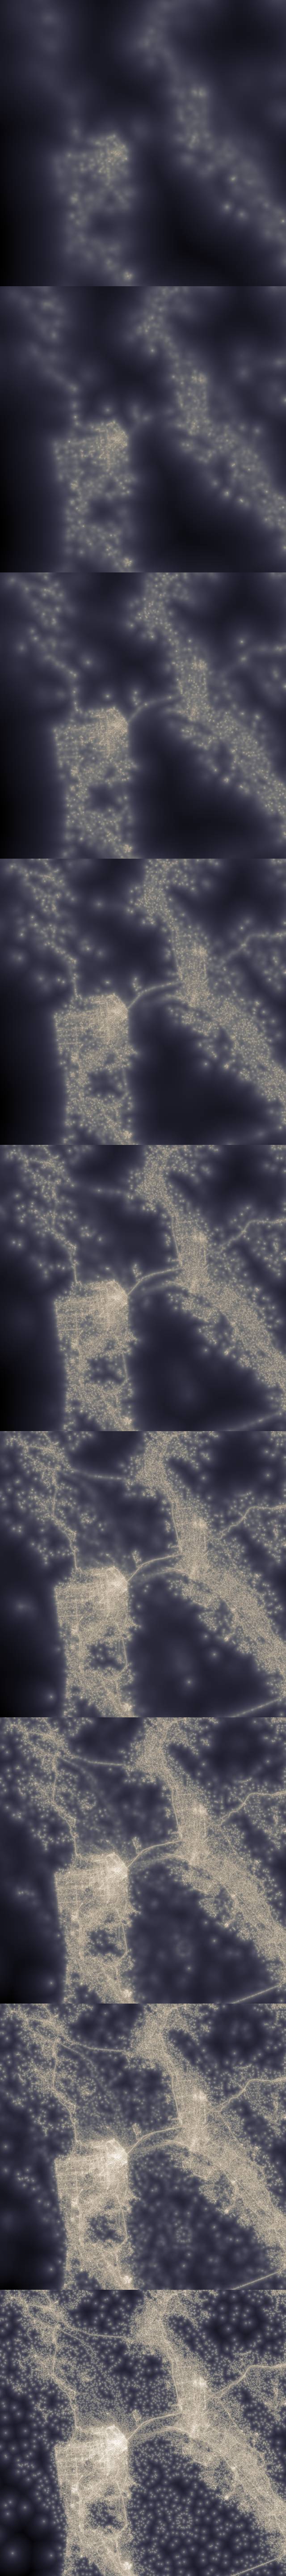
Carrier pigeon arrived. Note suggests k-nearest neighbors algorithm. Wired together prototype with k-d tree, priority queues. Bushwhacked to vicinity of TwitterPlex, wiggled “nearest neighbor” knob from one to 10000:
Peek a boo, San Francisco, ICU! ( Alternate views: “photo booth”-style or high res @ 1, 10, 100, 1000, and 10000 neighbors.)
2013-05-08 04:20Z:
Refocused on New York, London, Los Angeles, Tokyo, Jakarta, Paris:
 |  |  |
 |  |  |
Conclusions: Twitter oatmeal is lumpy, people love to Tweet from airport. More as becomes apparent.
Trolls soon. Signing off for now, Steve.